- Iris Data-set ( Used for predicting the type of flower that is the class of flower )
- Cancer Data-set ( Used to determine whether a person may have cancer or not based on 10 features
Pre-requisites :
- Pycharm installed with the following libraries : pandas , scipy , numpy , sklearn ( If not then refer tutorial here : https://codecenterorg.blogspot.in/2018/02/machine-learning-algorithms-basic.html
- Both the data-sets , which can be obtained here: https://www.4shared.com/rar/Qv5eI5EJei/ML_online.html
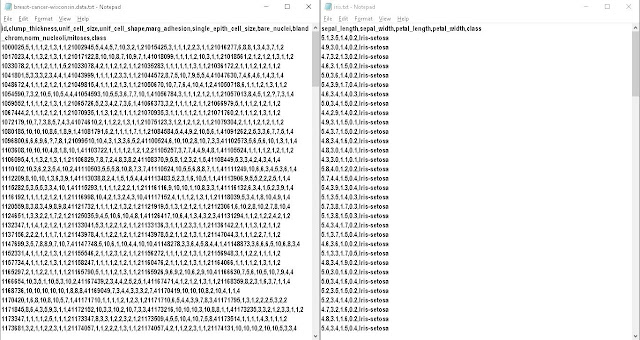
- Download the data-sets and extract them to get the data from the text file , it should look like the image given below :
The datasets are obtained from the following website : https://archive.ics.uci.edu/ml/index.php . The website also contains many different types of datasets which can be used for practice.
Iris Dataset
Explaination : The Iris dataset is one of the popular datasets for machine learning . It contains data from 150 flowers of 3 types . Each flower type has 50 records in the dataset . The dataset is classified according to 4 parameters :
1.Sepal length(cms)
2.Sepal width(cms)
3.Petal Length(cms)
4.Petal Width(cms)
5.Class (Determines whether a particular flower belongs to Iris-setosa , Iris-versicolor or Iris-virginica)
Program and Explanation :
1. Start pycharm and import the essential libraries
1. Start pycharm and import the essential libraries
import numpy as np  <-- Used for array implementation
from sklearn import neighbors,model_selection <-- Used for machine learning model Nearest neighbours and to split the data
import pandas as pd <-- Used to read the input file
2. Load the dataset using pandas and providing the path for the data-set . It is recommended to keep the dataset in the folder where the python file is located but if it is not present there then additional path should be given as passing parameter the the 'read_csv' function.
df = pd.read_csv('C:\\Users\\Udayan R Birajdar\\Desktop\\ML\\iris.txt') <-- Loading the dataset from a particular directory on desktop
3. In the 'class' folder of the dataset we can see that the data is given in String format and notin numbers but machine learning algorithms are made to process only numerical data so we convert that data to numbers. So 'iris-setosa' = 0 , 'iris-versicolor = 1' and 'iris-virginica = 2'
df['class']=df['class'].replace('Iris-setosa','0')
df['class']=df['class'].replace('Iris-versicolor','1')
df['class']=df['class'].replace('Iris-virginica','2')
4. Now we need to seperate the features and the labels for processing .
label = np.array(df['class']) <-- In the variable label , only the elements of column 'class' are included
features = np.array(df.drop('class',1)) <-- All the data except the class column is included 'features' variable
5. If we take a look at our data-set we can see that first 50 entries belong to 1 class , the next 50 to other and the last 50 to some other class . So if we provide the sorted data to our classifier , it will just memorise it and wont be as much accurate , so we shuffle the data . Also if we provide all the data to train our classifier then testing its accuracy would be difficult so we reserve some data as training data and some data as testing data. Here we provide test_size=0.2 that means 80% data is for training and 20% is for testing.
X_train,x_test,Y_train,y_test = model_selection.train_test_split(features,label,test_size=0.2)
X_train variable has 80% Training data (that is features : first 4 columns from the dataset)
Y_train variable has 80% Respective labels of the X_train data
Y_train variable has 80% Respective labels of the X_train data
x_test and y_ test contain the data which will be further used for testing purposes
6. Now our data is ready . We consider Knearestneighbour as our classifier to classify the data in this example. And we train the classifier by sending the X_train and Y_train as our training set
7. Now we calculate the accuracy of our data by testing the trained data against the test data.
6. Now our data is ready . We consider Knearestneighbour as our classifier to classify the data in this example. And we train the classifier by sending the X_train and Y_train as our training set
clf = neighbors.KNeighborsClassifier()
clf.fit(X_train,Y_train)
7. Now we calculate the accuracy of our data by testing the trained data against the test data.
accuracy = clf.score(x_test,y_test)
prin("Accuracy = ",accuracy*100)
8. Now in order to predict our own data we save that data inside a 2D array and pass the data to classifier.predict method.
prediction = [['4','0.2','1.8','0.2']]
result = clf.predict(prediction)
print("Result= ",result)
9. If we print the result we can see that we get ['0'] as the result , that means we have got the class for our predicted data as Iris-setosa , which is obvious as iris-setosa is the only class which has less sepal , petal length and width.
10. In this way we have successfully predicted the class of flower using the given data-set
10. In this way we have successfully predicted the class of flower using the given data-set
Cancer Prediction : This steps to implement this data set are same as iris data-set , the difference is there are 10 features and the label has 2 classes , whether the cancer is benign ( favourable; not cancerous) or malignant (cancerous) .
The python program for both the examples is provided on the github link below :
Iris Dataset : https://github.com/codecenterorg/Machine_Learning/blob/master/iris_dataset
Cancer Dataset : https://github.com/codecenterorg/Machine_Learning/blob/master/cancer_dataset


Comments
Post a Comment